It’s more than just learning the basics of the individual parts, though. My course will show you how to create a full fledged monitoring and alerting system, all from the open source Elastic components that make up the Elastic Stack. Each component works on Windows, Linux, or macOS so this course has something for everyone. Here’s a breakdown of what’s covered:
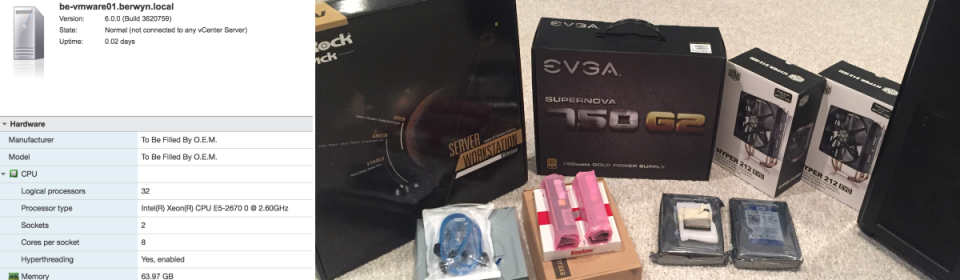
While working on my newest Pluralsight course this past Fall, I decided I wanted an easier way to create virtual machines on my local home network. Sure, it’s easy enough to spin up a few VMs on my iMac, but at some point the limitations of 16 gb of RAM and 4 processor cores was going to catch up with me. For this course in particular, I wanted to be able to run a half dozen or more VMs simultaneously to simulate a real corporate network with all or most components of the Elastic Stack running on it. What I really needed was a cheap virtual machine host with a lot of CPU cores and RAM and some reasonably fast disks. Before getting started on my course, I set out to build a server exclusively for the purpose of serving virtual machines on my network.
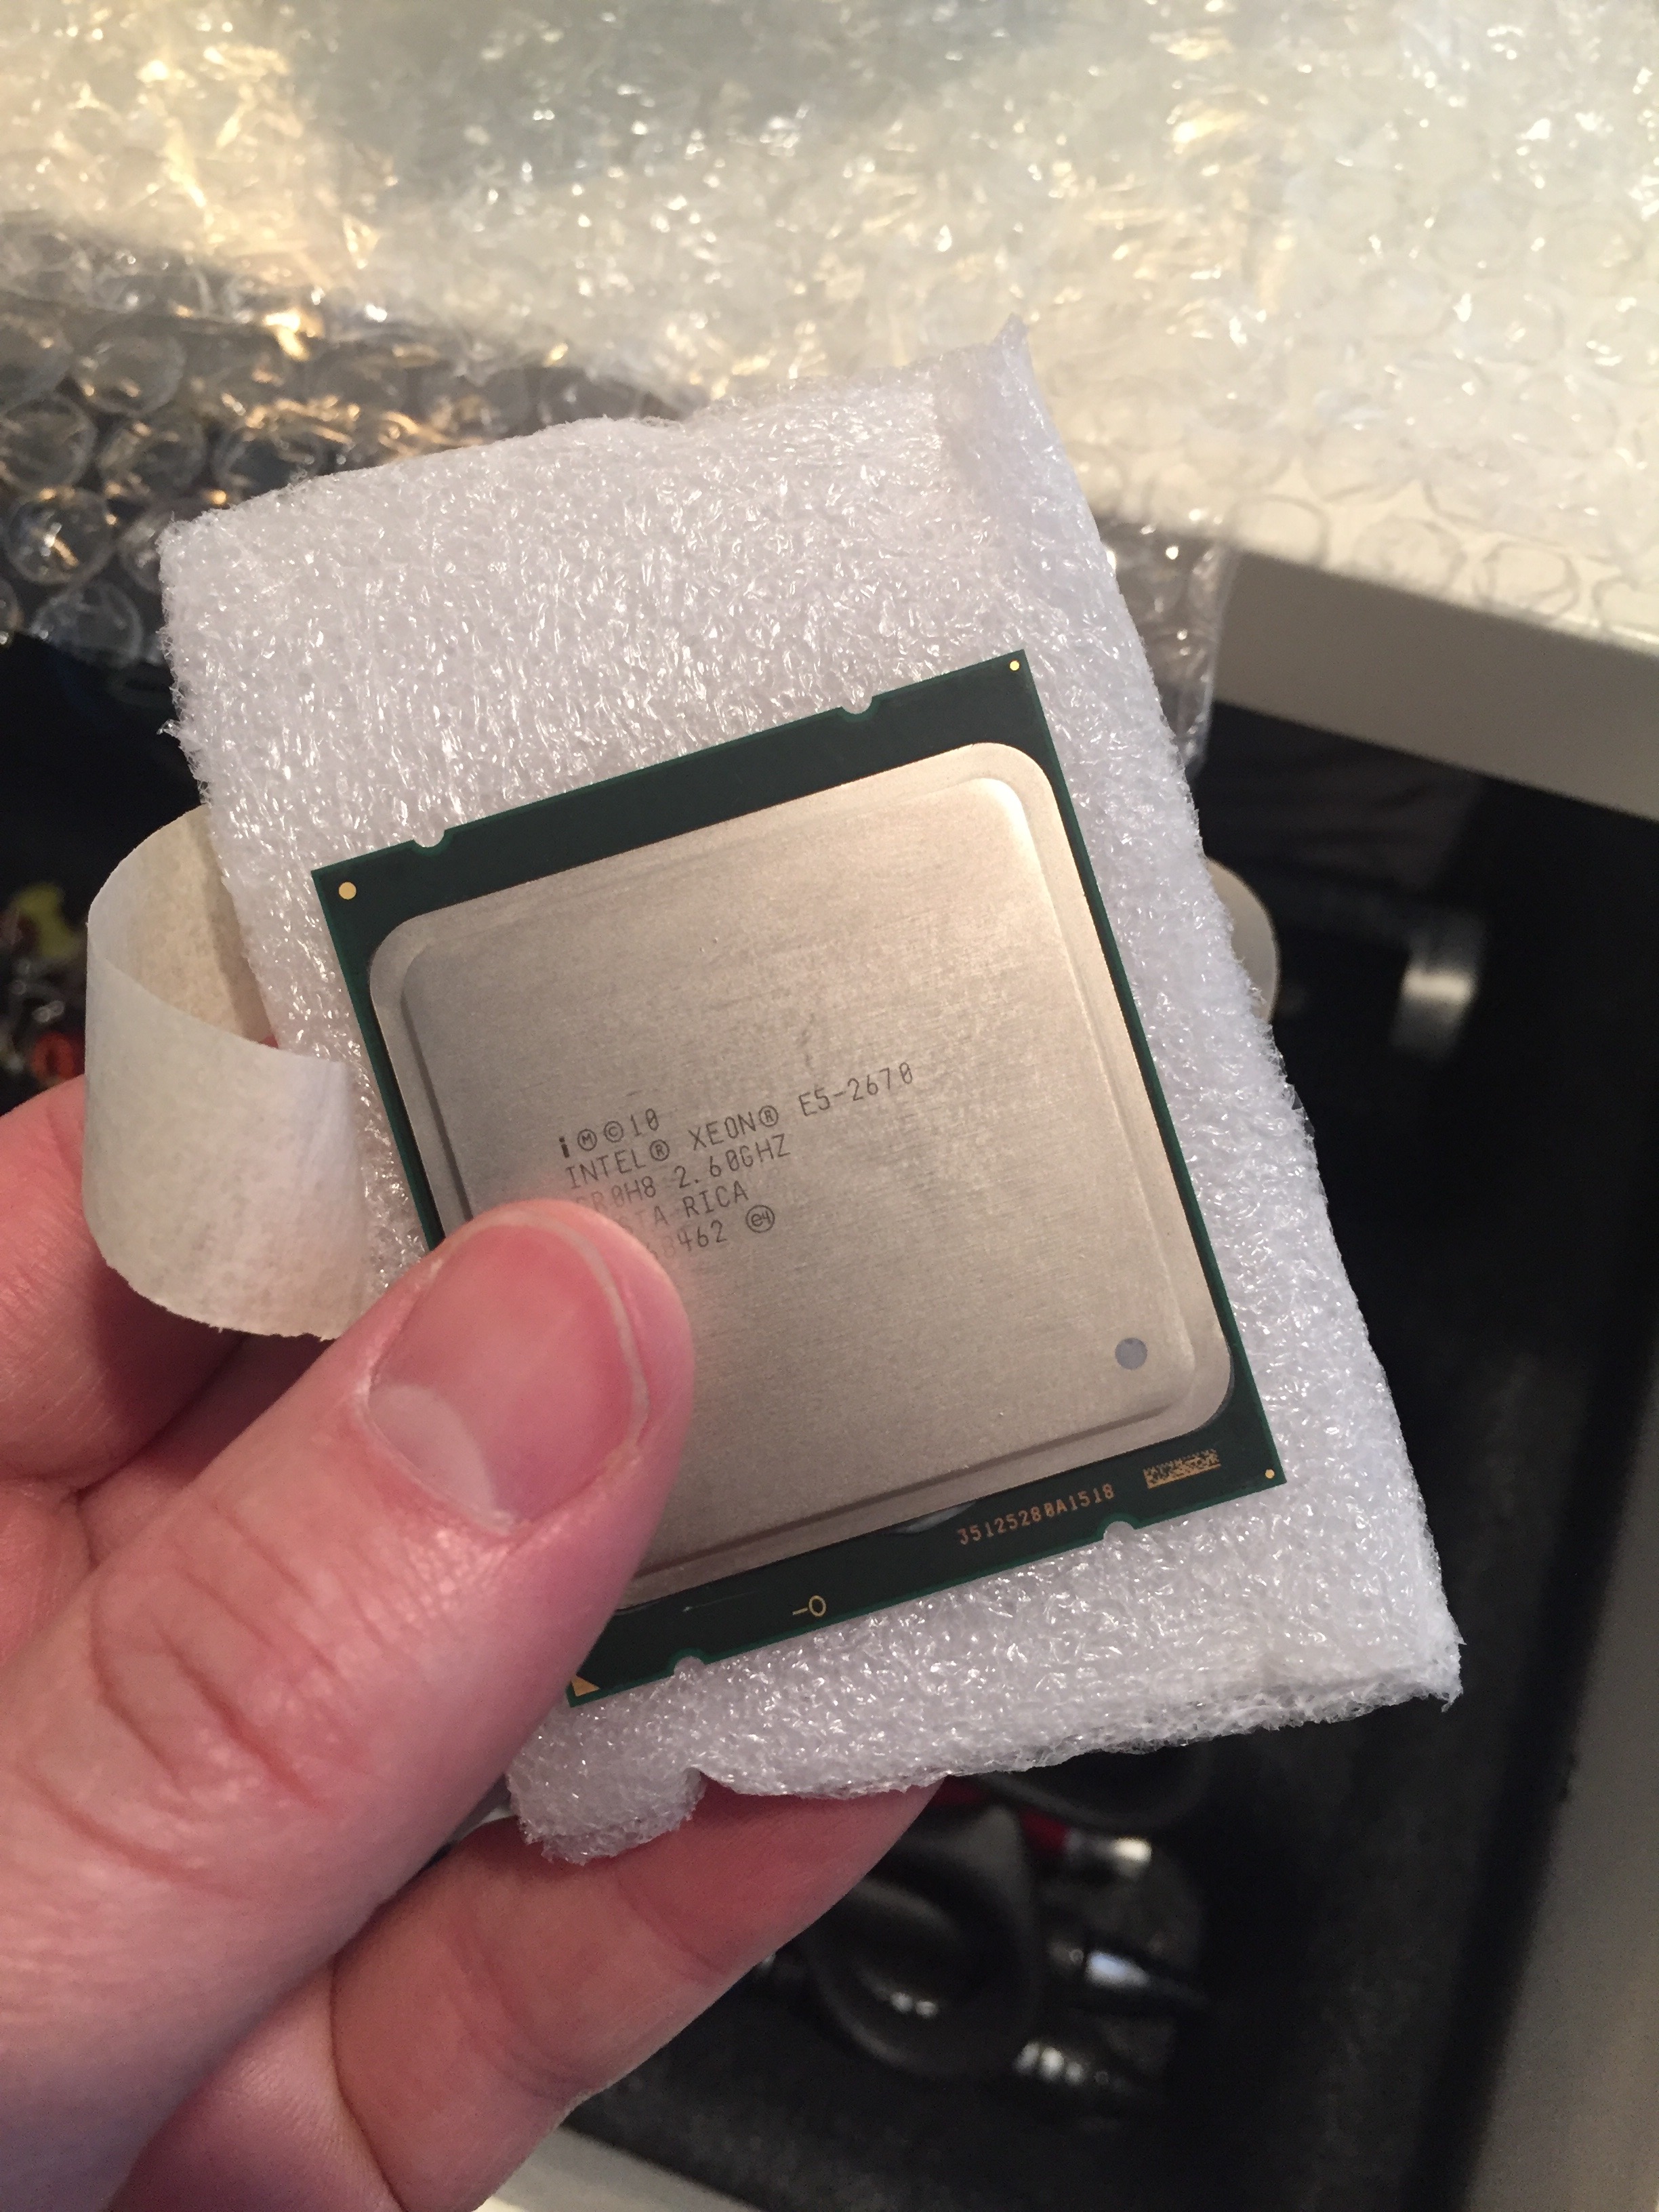
The centerpiece of the server build is the Intel Xeon E5-2670 CPU. The 2670 was released in 2012 with 8 cores (16 with Hyperthreading), and a full 20 mb L3 cache. By any measure it was a 64 bit x86 workhorse. Originally 2670s were priced at around $1,500 each which is far above the ~$1000 price tag I was hoping to keep the cost of this server under. As of this writing, however, you can find them on eBay for around $80. If you combine two of them, you end up with 32 logical cores which is an awful lot to spread around for virtual machines.
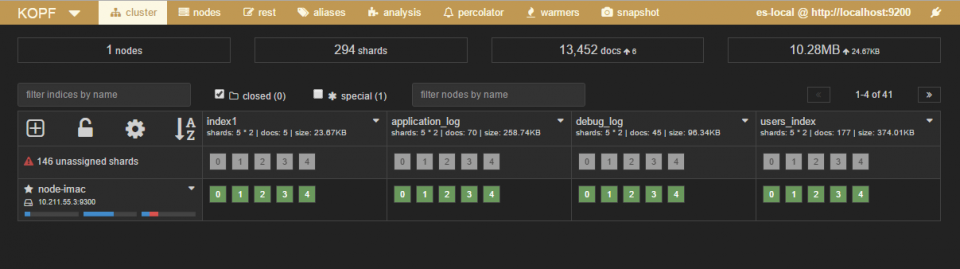
Working with Elasticsearch is wonderful but it can be a challenge to lasso together a coherent set of tools with which to manage and interact with your cluster. There is no one “do-everything” utility that includes 100% of the Elasticsearch query, operations, and administrative API functionality. There are a few good tools and plugins that I use, however, that round out a complete toolbox for using Elasticsearch effectively.
Operations
elasticsearch-head
The Elasticsearch head plugin is written by Ben Birch and is one of the old stalwarts that nearly everyone has used at one point to help manage an Elasticsearch cluster. It has a nice basic overview of indexes and includes some rudimentary administrative functionality like creating index aliases, running optimize, and easily viewing read-only data and cluster health. I still use this plugin pretty regularly but it has since been superseded by some more modern interfaces. It also falls down a bit, interface-wise, if you have a lot of indices in your cluster. You can install elasticsearch-head as a plugin directly from the Elasticsearch plugin command.
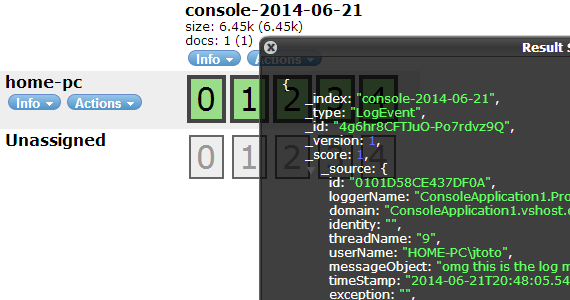
Today I made a small update to log4net.Elasticsearch so that users can optionally choose to have new indexes created each day. This was suggested in a Github issue and I think it’s a good idea. Many Elasticsearch indexes are managed on a rotating basis. It’s simple to create index aliases so that if any log readers or applications are reading directly from the Elasticsearch index, the index alias can be established nightly with a routine API call.
The connection string parameter is optional. Simply add
rolling=true
to your usual application connection string and the logger will take care of the rest. You can see an example of the setting on the sample App.config file in the Github repository.
Part of the work I do on Postmark is helping make sure we know what’s going on inside the system at any given time. We built a real-time(ish) monitoring system using Geckoboard and a variety of Windows Performance Counters, API endpoints, and database calls. I’ll save those details for another post.
Geckoboard provides an easy-to-use suite of widgets that speak JSON and XML so if you shoot your data at it on an interval (or provide it an API to poll), it’ll display the data through charts and graphs in ways that are useful to an audience. We use it extensively at Wildbit to keep an eye on all the various Postmark systems.
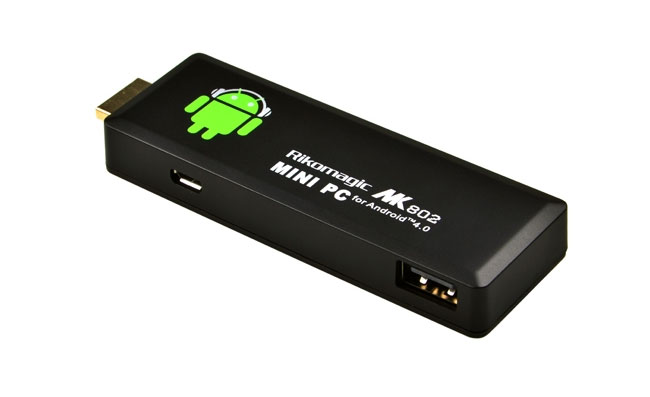
Having this information on display at our office for everyone to see is important so we arranged to show our Geckobard dashboards on 40 inch televisions, 2 for Beanstalk and 1 for Postmark. We bought 3 Rikomagic MK802 Android devices which are convenient since they come equipped with HDMI out and can be powered by the USB ports on the TVs.
The original MK802 device.
For the most part this worked well but there were some drawbacks to using the Android devices. The biggest problem was that we couldn’t seem to get a browser to run in full-screen or kiosk mode. A lot of screen real estate was taken up by the browser chrome and menus which meant less room was available for Geckoboard graphs. Last week the Android device powering the Postmark Geckoboard suffered some kind of disk encryption failure and stopped working. After a few failed attempts at restoring the MK802, I opted to try out my new Raspberry Pi to display the dashboard.
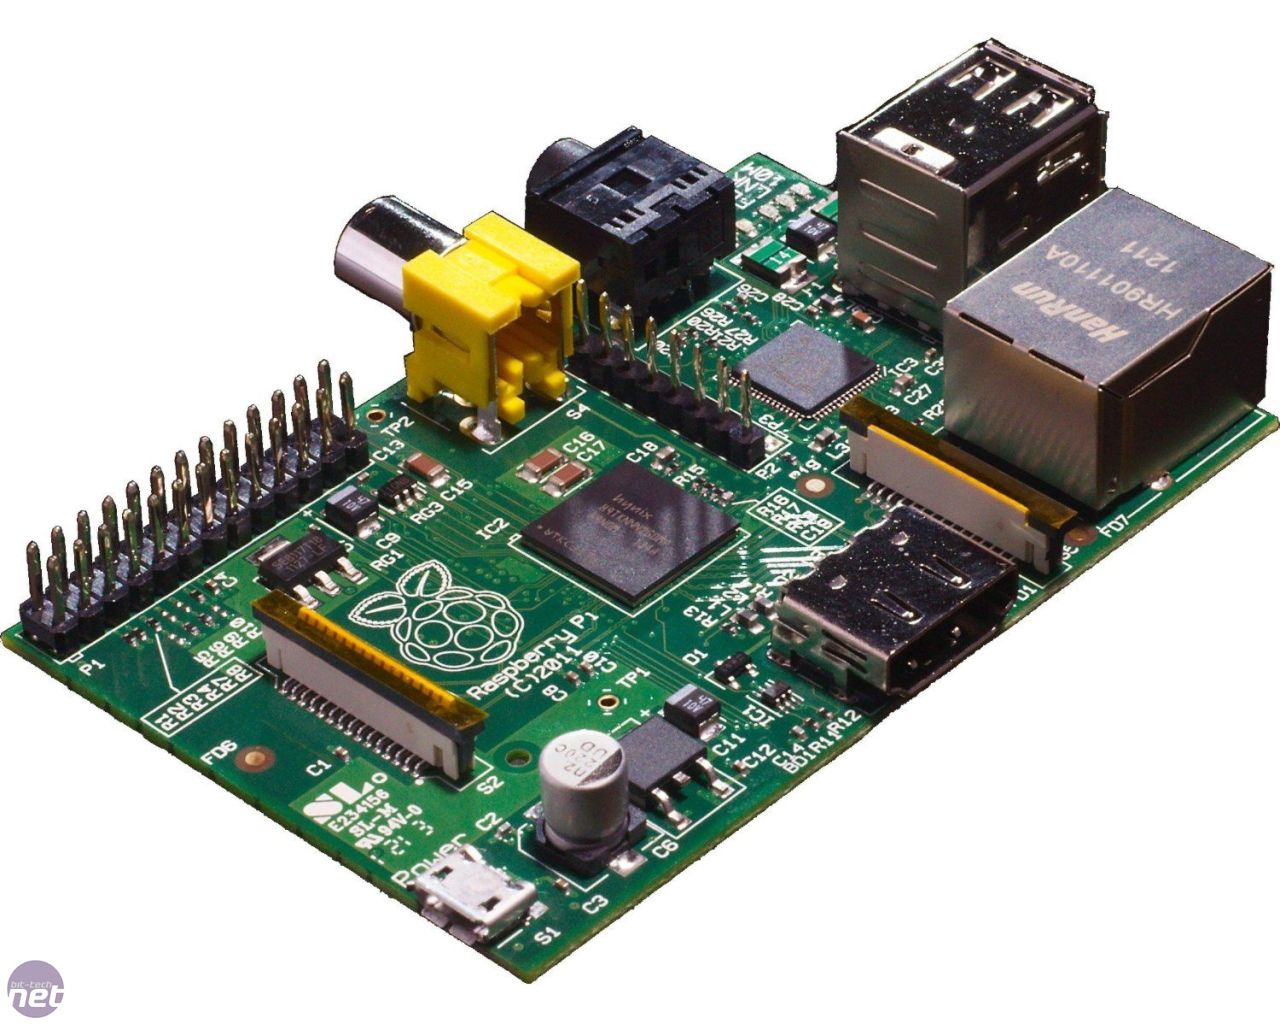
The way I saw it, there were no downsides to using the Pi instead of another MK802:
Cost is about the same.
Also comes with HDMI output and can be powered by the USB port on the TV.
Runs a full fledged Linux distro (Raspbian, among others) so it would be a familiar configuration setup.
Possible to run X11 and Chrome in kiosk mode for a more professional looking setup.
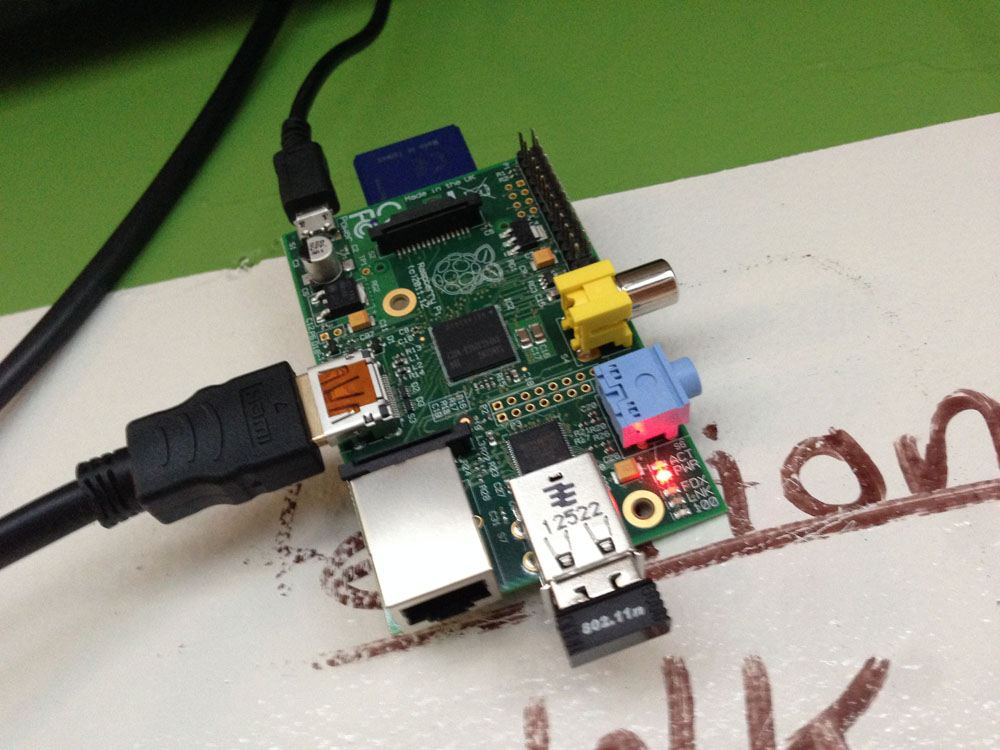
Raspberry Pi Model B
Following are the steps I took to create a fully automatic Raspberry Pi Geckoboard TV dashboard:
First you’ll need to install an operating system on your Pi. I’m using Raspbian ‘Wheezy’ which is a Debian derivative and one of the recommended choices. I won’t go into the installation details here. For that, I’ll direct you to their setup guide (PDF). You can go ahead and get through that first. It’s cool. I’ll wait. Make sure to get your wireless (or wired) networking going before trying to continue.
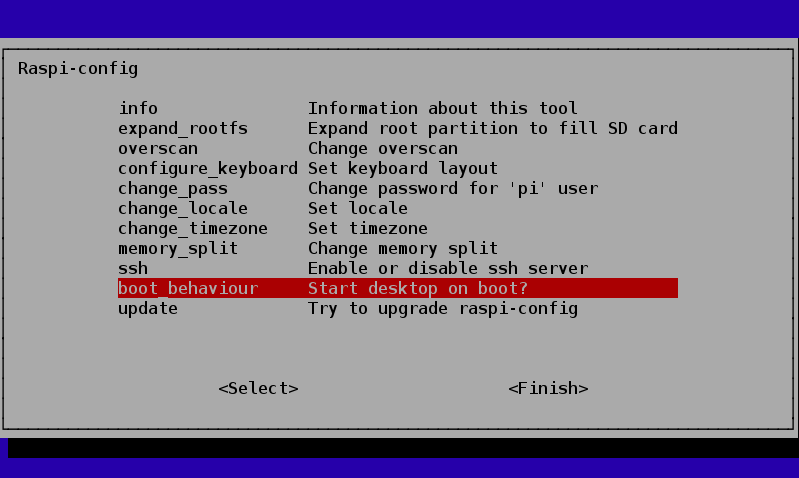
Set your Pi to boot to ‘desktop mode’ by default. This will go straight into the X desktop and window manager when you turn your Pi on. To do that, you’ll need to go into your raspi-config tool by typing:
sudo raspi-config
Setting up to boot direction to desktop mode.
Once that’s done, we’ll need to install a few things:
Now that we’ve got a few utilities installed and, more importantly, the Chromium browser, let’s make some configuration tweaks: (source)
Edit the /etc/xdg/lxsession/LXDE/autostart file
sudo nano /etc/xdg/lxsession/LXDE/autostart
Comment out the @screensaver line with a “#”
Add the following lines:
@xset s off
@xset -dpms
@xset s noblank
@chromium --kiosk --incognito http://link.to.dashboard/9894389439
That last line contains the link to which you want Chromium to be directed on bootup so put in the public link to your Geckoboard (or other dashboard).
Finally, you may need to force your Pi to use HDMI out if you are getting power from the TV. The Pi doesn’t detect the HDMI signal from the TV fast enough when you turn it on and disables the port on some TVs (this happened to me).
sudo nano /boot/config.txt
Remove the comment from the line:
hdmi_force_hotplug=1
That should keep your Pi outputting video to your HDMI output regardless if it detected the TV at first or not.
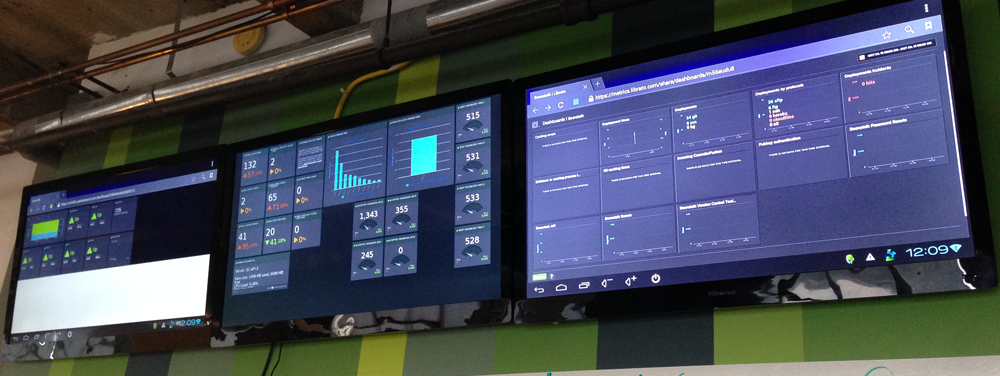
Final Product:
Our command center consists of 3 TVs, the middle is for Postmark. I still need to mount our Raspberry Pi properly since this was just a prototype setup. So far so good, however. I think we’ll replace the last two MK802s with Pis soon since it offers a superior dashboard experience.
Beanstalk and PostmarkCurrent setup. A little temporary.