This month I launched my newest Pluralsight course, Centralized Logging with the Elastic Stack: Getting Started. If you’ve ever wanted to understand how Elasticsearch, Kibana, Beats, and Logstash all work together. This is definitely the course you want to start with.
It’s more than just learning the basics of the individual parts, though. My course will show you how to create a full fledged monitoring and alerting system, all from the open source Elastic components that make up the Elastic Stack. Each component works on Windows, Linux, or macOS so this course has something for everyone. Here’s a breakdown of what’s covered:
- Introduction: I introduce the course and let you know what I’ll be teaching you. You should have a good understanding of what you’ll learn after spending about 2 hours watching all the demos and tutorials.
- Configuring Elasticsearch: Elasticsearch is the main nosql database that underpins the entire Elastic Stack demonstration of the course. It’s the most typical backend for building out an Elastic Stack system and the recommended solution. I don’t go into TOO much detail about Elasticsearch itself, just the installation and basic configuration. If you’d like to know more about developing with Elasticsearch or administering a cluster, I’ve got two other courses just for those:
– Introduction to Elasticsearch for .NET Develoepers and
– Managing an Elasticsearch Cluster - Installing Logstash: Logstash is a complex program and it can do an awful lot for you in terms of parsing and handling inbound and outbound log data. I will show you how to get it up and running with a configuration that will work for Beats inputs and Elasticsearch outputs with a sane approach to index naming.
- Visualizing with Kibana: Kibana is a great front-end for building dashboards to show realtime data changes and trends. In this module, I show you how to install and configure Kibana and hook it up to Elasticsearch.
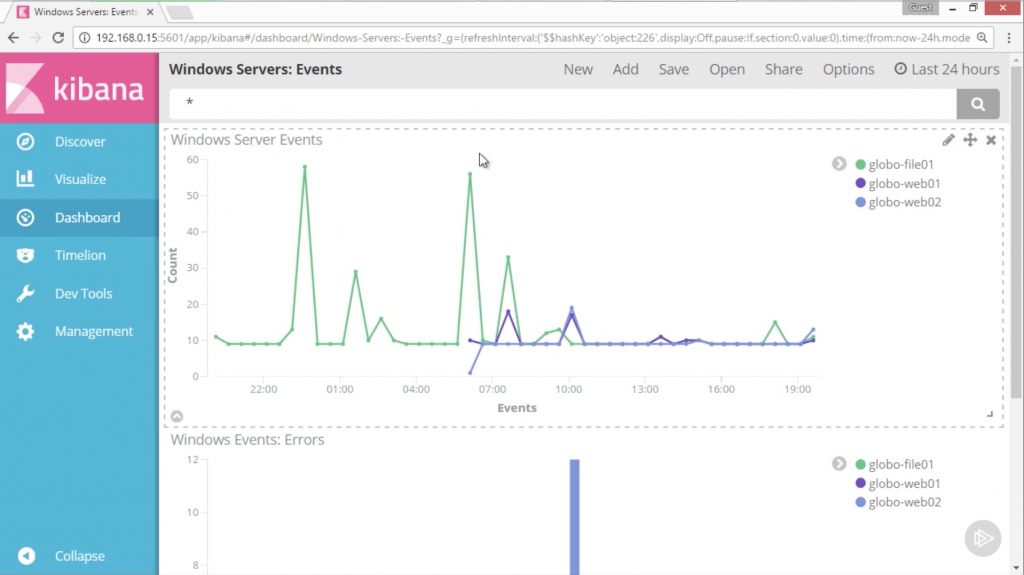
Graphing with Kibana - Instrumenting Windows Servers: First, I will teach you how to instrument the internal happenings of a Windows server. We’ll learn how to read the Windows Event Log and how to monitor system resources with Beats utilities.
- Instrumenting Linux Servers: Next, we’ll do a similar setup for a linux server. We’ll parse the system log and forward all those events through Logstash to Elasticsearch so they can be visualized in Kibana.
- Instrumenting Network Traffic: It’s possible to use the Beats applications to monitor network traffic on a host. We’ll setup some traffic monitoring, funnel it through Logstash, and again visualize it in Kibana so we can see a realtime chart about network trends.
- Instrumenting IIS Logs: Monitoring web server traffic is almost certainly on everyone’s todo list when setting up a monitoring system. This module will use IIS as an example and show you how to keep track of incoming web traffic and use a special plugin for Logstash to show where each http request is coming from!
- Alerting with Watcher: Finally, I’ll show you how to use the commercial Watcher plugin in order to setup active alerts for certain thresholds in the logs. We’ll learn how to setup queries that run in Elasticsearch to look for whatever criteria is set. When they are reached, we’ll get an email alert telling us there is a problem.

I hope you enjoy watching this course. I put a lot of time into producing it in the hopes that it can help you setup an effective, efficient, and cheap monitoring solution at your own company or institution. Feel free to contact me if you’ve got any questions about any of the modules.